Wait statistics part 1: The three DMVs

Wait statistics is the most important topic for analyzing database health. There’s three ways to do it.

sys.dm_os_wait_stats

This view is for system-wide analysis and the counters are cumulative since the last time your server was rebooted. Most scripts against this DMV will store the current values in a table, then wait for a specified amount of time before storing the new current values and comparing the difference.

That technique is great for analyzing overall system health because it gives you insights on every single wait statistic recorded during that time frame. However, I’ve found that this technique can be unreliable when my production systems are heavily pressured for CPU or memory.

sys.dm_os_waiting_tasks

As the name might imply, this view shows tasks that are currently waiting, along with their session_id, so you can use dm_exec_requests and dm_exec_sessions with this view to get detailed information on currently waiting sessions.

In my experience, this view is very reliable when there’s TempDB pressure on the system. It’s great, and I’m including my favorite script for this view below.

I don’t know who originally wrote this script, I found it in the “Diagnosing Latch Contention” whitepaper from the Microsoft Customer Advisory Team here.

SELECT wt.session_id, wt.wait_type 
, er.last_wait_type AS last_wait_type 
, wt.wait_duration_ms 
, wt.blocking_session_id, wt.blocking_exec_context_id, resource_description 
FROM sys.dm_os_waiting_tasks wt 
JOIN sys.dm_exec_sessions es ON wt.session_id = es.session_id 
JOIN sys.dm_exec_requests er ON wt.session_id = er.session_id 
WHERE es.is_user_process = 1 
AND wt.wait_type <> 'SLEEP_TASK' 
ORDER BY wt.wait_duration_ms desc

sys.dm_exec_session_wait_stats

New in SQL Server 2016, I haven’t used this DMV for wait statistics troubleshooting. If I can find a way this is useful, I’ll write a post!

Thanks for reading, stay tuned.

[Off topic/Personal] 2018 and 2019 goals

Hi. Thanks for reading my blog! Seriously, I appreciate every single visit. This post is about my personal experiences this year and next year, for technical content please feel free to skip this post.

Thoughts on 2018

It seems like this year has been extra long. That’s not a bad thing, I enjoyed this year.

At the start of the year, I spoke at SQL Saturday #698, Nashville. This was a great experience, Tammy and Kerry and the rest of the Nashville team run a great event. During this event, it snowed in Nashville which is such a weird experience! But the show still went on, and I met a ton of people.

I continued the year with a ton of speaking. I spoke at SQL Saturday Cleveland, SQL Sat Madison, SQL Sat Chicago, SQL Sat Iowa City, and SQL Sat Minnesota.

I also spoke at the suburban and city user groups in Chicago.

Remote presentations in 2018

I did my first remote presentation for EDMPass, with help from Chris Woods. Then I got a chance to speak at GroupBy.org. Wow. That was the hardest event of all, since I knew it would be immortalized on YouTube for eternity. If you’d like to hear more about the GroupBy conference, please check out my post on the experience.

In summary, 2018 was a great year for speaking. I had a great time and met so many amazing people. Thank you for everyone who have been so welcoming to me.

Speaking in 2019

2019 is going to be a different year. I’ve started to spend more time blogging and I enjoy it a lot!

I’m planning to continue speaking. More to come on this, I plan to put out a offer to speak for groups that need a presenter, and I’ve submitted for SQL Sat Chicago.

If you know you need a presenter in 2019, please reach out on twitter through DMs.

What do I want in 2019

I have three main goals in 2019.

First, I want the senior DBA title. I know it’s just a title, but it means a lot to me. When I met my first mentor, that was his title. In a way, it’s my way of saying I want to reach the level of my old mentor.

Second and third goals will have to be redacted since this blog is public. I want to achieve a monetary goal, and I have a personal goal for life progress. I admire the way that Brent Ozar is open about his goals on ozar.me, so I promise once I’ve achieved those second and third goals that I will blog about them.


Changing max memory: be careful!

If you’re increasing your server’s memory, simultaneously adding more max memory for SQL always seems like a good thing. Let’s talk about what changes when you change the setting for max memory. For the basics, start here.

In SQL Server, increasing max memory will give more memory for data stored in buffer and all sorts of other good things. There is one bad side: your queries that request memory grants may change how much memory they request.

Hopefully your servers have more memory than my blog/presentation laptop. This demo scales, so don’t worry about the small size in my test.

Starting position: max memory at 3 GB

We need a query that wants a memory grant, so I’ll use a query with a sort that returns a lot of rows.

SELECT Tags, Title
FROM Posts
WHERE PostTypeId = 1
ORDER BY Title

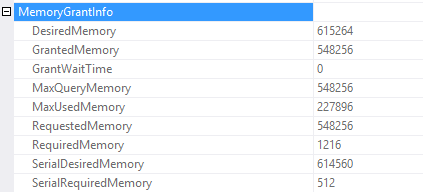
Here’s the memory grant from the actual execution plan’s properties. The query wants 615,264 KB of memory, but it was only granted 548,256.

More power! What happens with increased SQL Server max memory?

Same query but with more max memory. In this case, the execution plan stayed the same but the memory grant increased.

This time, all the desired memory was granted. With the lower max memory setting, the query requested 548,256 and now it requests 615,264.

When changing max memory, test

I wanted to write this post to prove that changing SQL Server max memory has an impact on your query’s performance. For this query, a higher memory grant could be a good thing.

If you’re changing SQL Server settings, testing the impact on a test system is recommended.

The SQL_Handle

Following up on my post on query_hash, the sql_handle is an attribute that describes the query sent to SQL Server.

While the query_hash ignores parameters and white space, the sql_handle is based on literally every single value passed to the server in the query.

Demo time: creating a sql_handle

I’m re-using the same query from the query_hash example.

--query 1
SELECT *
FROM Posts
WHERE PostTypeId = 3

I want to look at that statement sql handle. In the post I call it the sql_handle because that’s the column name in the DMV sys.dm_exec_query_stats. In this execution plan, it’s called the StatementSqlHandle.

I don’t care about the specific characters, I just want to copy that text so we can compare it when I change the SQL text.

0x09008FDEE199219B35B3DC66E11B711BBB3F0000000000000000000000000000000000000000000000000000

Now, changing the query text.

--query 1
SELECT *
FROM Posts
WHERE PostTypeId = 4
0x09001F315F1B62BE1F84C4627B28CDF75E720000000000000000000000000000000000000000000000000000

It’s a different sql handle!

So that’s the interesting part about sql handles. All I did was change the parameter value, and despite having the same query hash, now the query has a new sql handle.

--query 1
SELECT *
FROM Posts WHERE PostTypeId=3
0x09009B8BBE17746F76A78E1312DF44C65FFA0000000000000000000000000000000000000000000000000000

There’s the third, new sql handle. That’s the tricky thing about sql handles, they’re so very specific to the exact query that was passed in.

If you’re searching for ad hoc queries

When you’re querying the plan cache, look for queries with the same query_hash. They might each have their own sql_handle.

Finally, here’s all three sql handles side by side

--I deleted the zeros at the end so it's easier to compare
0x09008FDEE199219B35B3DC66E11B711BBB3F
0x09001F315F1B62BE1F84C4627B28CDF75E72
0x09009B8BBE17746F76A78E1312DF44C65FFA

Thanks for reading! Stay tuned for query plan hash and plan handle, the other descriptors of queries.

Query hash: your query text’s fingerprint

Let’s talk about execution plans and query attributes.

Query hash is a way to describe queries that have the same query text, excluding the parameters. I think the best way to show this is examples, so I’ll write some queries and show you the query hashes on my system.

Keep in mind that these queries are ad-hoc

--query 1
SELECT *
FROM Posts
WHERE PostTypeId = 3
--query 2
SELECT *
FROM Posts
WHERE PostTypeId = 1

So what does that show us?

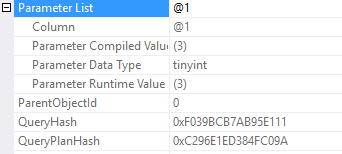
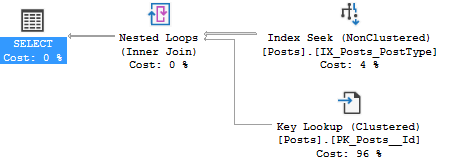
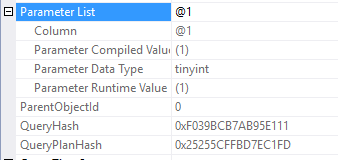
If your SQL statement is the same but the parameters are different, the query hash will be the same. Even if the execution plan is entirely different!

What about white space?

This is an important concept. For the query hash, the white space won’t change the query hash, but it will change the other objects like the sql handle. Let’s take the first query, and shape the text.

--query 1, remix
SELECT*FROM Posts 
WHERE 
PostTypeId = 3

More details to come

There’s more attributes to the query, like the query plan hash, the sql handle, and the plan handle. I’ll handle those in the next blog posts.

One bad T-SQL practice: ISNULL in the WHERE clause

This is a really common T-SQL pattern that I see over and over. Let me show you an example.

--Table Schema
CREATE TABLE [dbo].[Teachers](
	[Names] [varchar](100) NULL,
	[Type] [int] NULL
) 
GO
CREATE NONCLUSTERED INDEX [ix_TeachersType] ON [dbo].[Teachers]([Type])
GO

Now, I’ll added some data into Names from StackOverflow2010’s display names, and I assigned Type randomly, with some NULL values.

Here’s a basic query using ISNULL in the WHERE clause

set statistics io on;
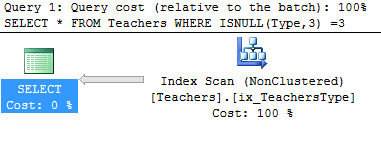
SELECT * FROM Teachers WHERE ISNULL(Type,3) =3 

Statistics and execution plan:

Table 'Teachers'. Scan count 1, logical reads 895, physical reads 0, read-ahead reads 0, lob logical reads 0, lob physical reads 0, lob read-ahead reads 0.

The alternative: WHERE Type = 3 or Type is null

That’s a better alternative, but don’t take my word for it. Let’s look at the example again.

set statistics io on;
SELECT * FROM Teachers WHERE Type = 3 or Type is null

Statistics and execution plan:

Table 'Teachers'. Scan count 2, logical reads 68, physical reads 0, 
read-ahead reads 0, lob logical reads 0, lob physical reads 0, lob read-ahead reads 0.

Why is there a difference?

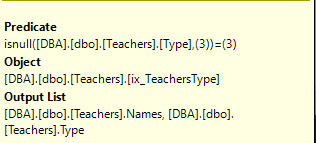
In the example shown, the query with ISNULL did more page reads and chose to use an Index Scan. When simply re-written to use “OR IS NULL”, the query did less work to retrieve the same results. But why?

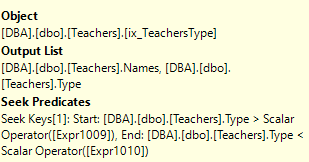
The answer is in the execution plans, specifically the predicates. First, here’s the predicates in the ISNULL(Type,3) query.

For comparison, here’s the OR IS NULL re-write:

More than just ISNULL()

This is just one example of using a function in the WHERE clause. When writing database queries, avoid applying any functions to columns in the query. It adds another layer that can cause poor performance.


Can you drop a table that’s used in a stored procedure?

Today’s post comes directly from a conversation with a close friend of mine who is a developer. Since developers deploy changes often, they need to know what order to execute their changes in.

The answer is yes, but there’s a catch

By default, normal stored procedures don’t prevent you from dropping a table. Let’s look at a demo.

SELECT *
INTO TestTable
FROM sys.messages
GO

INSERT INTO TestTable
SELECT * FROM sys.messages
GO 10

That should give us plenty of junk data. Now we need a procedure, so let’s SELECT * from that new table.

CREATE PROCEDURE [Query_TestTable] as 
BEGIN
SELECT * FROM TestTable
END
GO

Now we just need to drop the table.


Once we drop the table, the stored procedure returns an error.


But I said there’s a catch. The catch is if the stored procedure is currently running, you can’t drop the procedure.

First, re-run the script to create the table and insert some rows.

Second, start running the procedure. Then run the drop table command and watch it wait. I’ll use sp_WhoIsActive to take a look at the current running processes.

LCK_M_X (sound familiar?)

It looks a lot like LCK_M_SCH_S, which I previously blogged about here.

In this case, the X stands for exclusive. Before we can drop the table, the stored procedure has to finish using the table.

Thanks for reading! Stay tuned.


Execution plans: more than one missing index?

Missing index requests look like Staple’s Easy button. We just want to press it and get faster performance. I’m sorry to report that the missing index in your execution plan might not be the answer. It might also have additional missing index requests that you didn’t know about!

First, we need a query

I’m taking this example directly from my Reading Execution Plans Successfully presentation and I used the AdventureWorks2014 database to run all these tests.

SELECT *
FROM AdventureWorks2014.Production.TransactionHistoryArchive
WHERE TransactionDate = '2011-05-01'
UNION ALL
SELECT *
FROM AdventureWorks2014.Production.TransactionHistoryArchive
WHERE ActualCost IN(50, 25, 30);

Keep in mind that there’s no index on either ActualCost or TransactionDate, by default in AdventureWorks. Let’s run that query and get the actual execution plan.

SQL Server is requesting a missing index with an impact of 31, on ActualCost. I’ll refer to this as missing index #1. Here’s the definition of the missing index request.

USE [AdventureWorks2014]
GO
CREATE NONCLUSTERED INDEX [<Name of Missing Index, sysname,>]
ON [Production].[TransactionHistoryArchive] ([ActualCost])
INCLUDE ([TransactionID],[ProductID],[ReferenceOrderID],[ReferenceOrderLineID],[TransactionDate],[TransactionType],[Quantity],[ModifiedDate])
GO

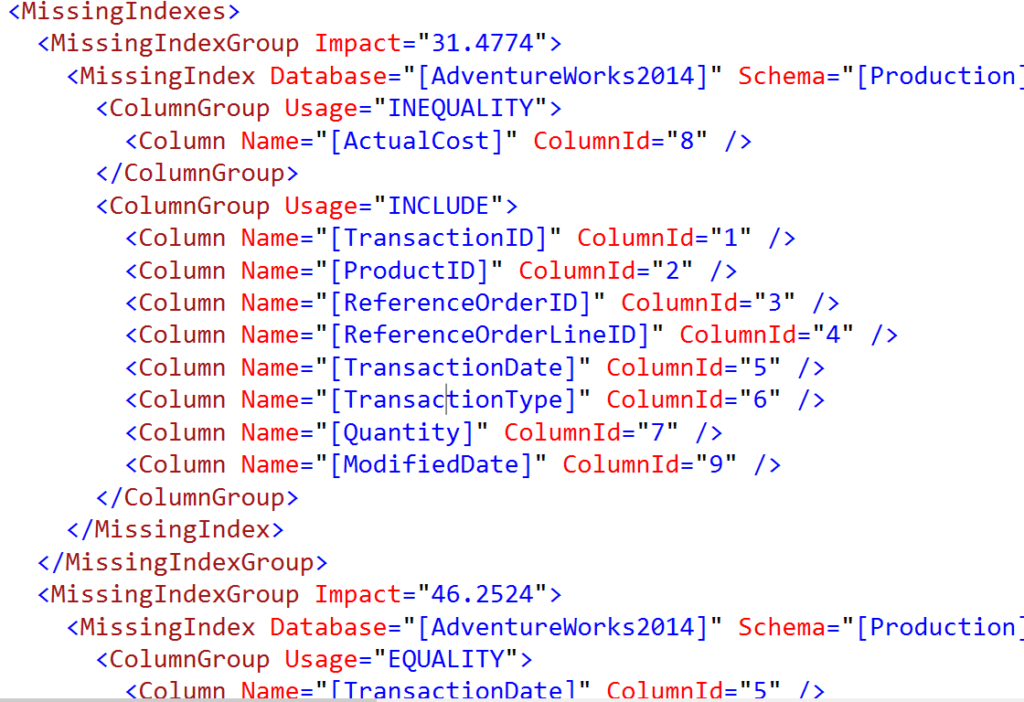
This is missing index request #1, and by default, this is the only missing index we’ll see by looking at the graphical execution plan. There’s actually a missing index request #2, which we can find in the XML (I know, it’s a little ugly to read. Bear with me).

Missing index request #2

That’s a snippet of the XML from the same execution plan. At the top, the 31 cost missing index request is for missing index #1. Right below that, there’s the entire definition of another missing index, request #2.

I find this example interesting because the query starts with a ‘where’ clause on the TransactionDate, and the server estimates the impact of that missing index to be 46, which is higher than 31. Yet when we look in the graphical view, the only request for an index that we can see is request #1, on ActualCost.

What’s the moral of this post?

This is just one of many reasons that missing index requests can be unreliable. I wrote this example specifically to demonstrate that there can be more than one missing index request in a single query.

Stay tuned! More performance posts coming out soon.


Favorite DMVs: sys.dm_exec_input_buffer

This is post 2 in my favorite DMVs series. I’m cheating a little and picking a Dynamic Management Function for this one.

DBCC INPUTBUFFER vs sys.dm_exec_input_buffer

If you’re still using DBCC INPUTBUFFER, that’s okay. I just want to show you why you should consider using dm_exec_input_buffer  instead. According to the documentation, you can start using this function as long as your server is SQL Server 2014 SP2 or higher.

Why it’s useful

So why do I like this function so much? I like it because it’s so fast and it allows you to check input SQL commands across many different sessions at once. If your server is experiencing pressure across CPU, memory or other resources, having something this fast in your toolbelt can be incredibly useful.

Useful columns

event_info: This nvarchar(max) column is the only output column that I care about it, and it’s the query that was submitted to your server

Examples

To set up an example for this post, I’ve created a parameter sniffing scenario that I use in my Plan Cache Performance Tuning session.

Essentially, there’s a plan in cache for PostType = 1, and I’m running a lot of queries looking for PostType = 3. The plan in cache isn’t optimal for the queries executing, and they take a long time to execute. That said, here’s the example:

SELECT 
	s.program_name, 
	input_buffer.event_info
FROM sys.dm_exec_sessions as s 
JOIN sys.dm_exec_requests as r on r.session_id = s.session_id
CROSS APPLY sys.dm_exec_input_buffer(s.session_id, r.request_id) as input_buffer
WHERE s.is_user_process = 1 
and s.status = 'running' 

More details

I’ll be posting a full script using some of these DMVs in my blog later this week, so please stay tuned!

By continuing to use the site, you agree to the use of cookies. more information

The cookie settings on this website are set to "allow cookies" to give you the best browsing experience possible. If you continue to use this website without changing your cookie settings or you click "Accept" below then you are consenting to this.

Close