The SQL_Handle

Following up on my post on query_hash, the sql_handle is an attribute that describes the query sent to SQL Server.

While the query_hash ignores parameters and white space, the sql_handle is based on literally every single value passed to the server in the query.

Demo time: creating a sql_handle

I’m re-using the same query from the query_hash example.

--query 1
SELECT *
FROM Posts
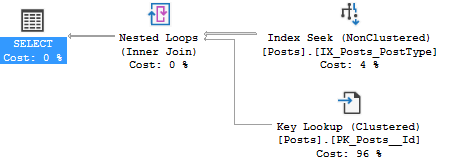
WHERE PostTypeId = 3

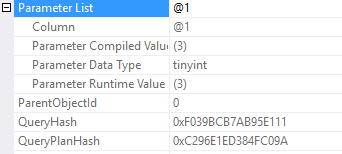
I want to look at that statement sql handle. In the post I call it the sql_handle because that’s the column name in the DMV sys.dm_exec_query_stats. In this execution plan, it’s called the StatementSqlHandle.

I don’t care about the specific characters, I just want to copy that text so we can compare it when I change the SQL text.

0x09008FDEE199219B35B3DC66E11B711BBB3F0000000000000000000000000000000000000000000000000000

Now, changing the query text.

--query 1
SELECT *
FROM Posts
WHERE PostTypeId = 4
0x09001F315F1B62BE1F84C4627B28CDF75E720000000000000000000000000000000000000000000000000000

It’s a different sql handle!

So that’s the interesting part about sql handles. All I did was change the parameter value, and despite having the same query hash, now the query has a new sql handle.

--query 1
SELECT *
FROM Posts WHERE PostTypeId=3
0x09009B8BBE17746F76A78E1312DF44C65FFA0000000000000000000000000000000000000000000000000000

There’s the third, new sql handle. That’s the tricky thing about sql handles, they’re so very specific to the exact query that was passed in.

If you’re searching for ad hoc queries

When you’re querying the plan cache, look for queries with the same query_hash. They might each have their own sql_handle.

Finally, here’s all three sql handles side by side

--I deleted the zeros at the end so it's easier to compare
0x09008FDEE199219B35B3DC66E11B711BBB3F
0x09001F315F1B62BE1F84C4627B28CDF75E72
0x09009B8BBE17746F76A78E1312DF44C65FFA

Thanks for reading! Stay tuned for query plan hash and plan handle, the other descriptors of queries.
Query hash: your query text’s fingerprint

Let’s talk about execution plans and query attributes.

Query hash is a way to describe queries that have the same query text, excluding the parameters. I think the best way to show this is examples, so I’ll write some queries and show you the query hashes on my system.

Keep in mind that these queries are ad-hoc

--query 1
SELECT *
FROM Posts
WHERE PostTypeId = 3
--query 2
SELECT *
FROM Posts
WHERE PostTypeId = 1

So what does that show us?

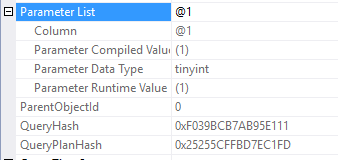
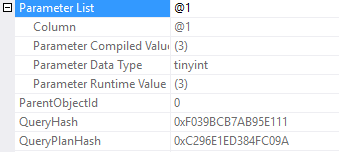
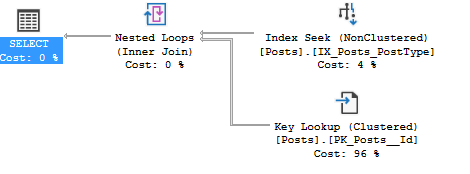
If your SQL statement is the same but the parameters are different, the query hash will be the same. Even if the execution plan is entirely different!

What about white space?

This is an important concept. For the query hash, the white space won’t change the query hash, but it will change the other objects like the sql handle. Let’s take the first query, and shape the text.

--query 1, remix
SELECT*FROM Posts 
WHERE 
PostTypeId = 3

More details to come

There’s more attributes to the query, like the query plan hash, the sql handle, and the plan handle. I’ll handle those in the next blog posts.

One bad T-SQL practice: ISNULL in the WHERE clause

This is a really common T-SQL pattern that I see over and over. Let me show you an example.

--Table Schema
CREATE TABLE [dbo].[Teachers](
	[Names] [varchar](100) NULL,
	[Type] [int] NULL
) 
GO
CREATE NONCLUSTERED INDEX [ix_TeachersType] ON [dbo].[Teachers]([Type])
GO

Now, I’ll added some data into Names from StackOverflow2010’s display names, and I assigned Type randomly, with some NULL values.

Here’s a basic query using ISNULL in the WHERE clause

set statistics io on;
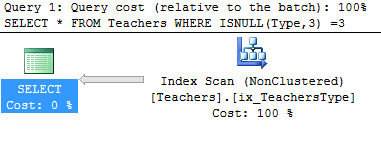
SELECT * FROM Teachers WHERE ISNULL(Type,3) =3 

Statistics and execution plan:

Table 'Teachers'. Scan count 1, logical reads 895, physical reads 0, read-ahead reads 0, lob logical reads 0, lob physical reads 0, lob read-ahead reads 0.

The alternative: WHERE Type = 3 or Type is null

That’s a better alternative, but don’t take my word for it. Let’s look at the example again.

set statistics io on;
SELECT * FROM Teachers WHERE Type = 3 or Type is null

Statistics and execution plan:

Table 'Teachers'. Scan count 2, logical reads 68, physical reads 0, 
read-ahead reads 0, lob logical reads 0, lob physical reads 0, lob read-ahead reads 0.

Why is there a difference?

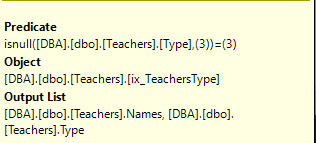
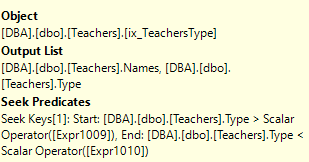
In the example shown, the query with ISNULL did more page reads and chose to use an Index Scan. When simply re-written to use “OR IS NULL”, the query did less work to retrieve the same results. But why?

The answer is in the execution plans, specifically the predicates. First, here’s the predicates in the ISNULL(Type,3) query.

For comparison, here’s the OR IS NULL re-write:

More than just ISNULL()

This is just one example of using a function in the WHERE clause. When writing database queries, avoid applying any functions to columns in the query. It adds another layer that can cause poor performance.


Can you drop a table that’s used in a stored procedure?

Today’s post comes directly from a conversation with a close friend of mine who is a developer. Since developers deploy changes often, they need to know what order to execute their changes in.

The answer is yes, but there’s a catch

By default, normal stored procedures don’t prevent you from dropping a table. Let’s look at a demo.

SELECT *
INTO TestTable
FROM sys.messages
GO

INSERT INTO TestTable
SELECT * FROM sys.messages
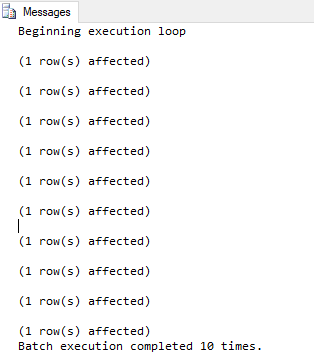
GO 10

That should give us plenty of junk data. Now we need a procedure, so let’s SELECT * from that new table.

CREATE PROCEDURE [Query_TestTable] as 
BEGIN
SELECT * FROM TestTable
END
GO

Now we just need to drop the table.


Once we drop the table, the stored procedure returns an error.


But I said there’s a catch. The catch is if the stored procedure is currently running, you can’t drop the procedure.

First, re-run the script to create the table and insert some rows.

Second, start running the procedure. Then run the drop table command and watch it wait. I’ll use sp_WhoIsActive to take a look at the current running processes.

LCK_M_X (sound familiar?)

It looks a lot like LCK_M_SCH_S, which I previously blogged about here.

In this case, the X stands for exclusive. Before we can drop the table, the stored procedure has to finish using the table.

Thanks for reading! Stay tuned.


Execution plans: more than one missing index?

Missing index requests look like Staple’s Easy button. We just want to press it and get faster performance. I’m sorry to report that the missing index in your execution plan might not be the answer. It might also have additional missing index requests that you didn’t know about!

First, we need a query

I’m taking this example directly from my Reading Execution Plans Successfully presentation and I used the AdventureWorks2014 database to run all these tests.

SELECT *
FROM AdventureWorks2014.Production.TransactionHistoryArchive
WHERE TransactionDate = '2011-05-01'
UNION ALL
SELECT *
FROM AdventureWorks2014.Production.TransactionHistoryArchive
WHERE ActualCost IN(50, 25, 30);

Keep in mind that there’s no index on either ActualCost or TransactionDate, by default in AdventureWorks. Let’s run that query and get the actual execution plan.

SQL Server is requesting a missing index with an impact of 31, on ActualCost. I’ll refer to this as missing index #1. Here’s the definition of the missing index request.

USE [AdventureWorks2014]
GO
CREATE NONCLUSTERED INDEX [<Name of Missing Index, sysname,>]
ON [Production].[TransactionHistoryArchive] ([ActualCost])
INCLUDE ([TransactionID],[ProductID],[ReferenceOrderID],[ReferenceOrderLineID],[TransactionDate],[TransactionType],[Quantity],[ModifiedDate])
GO

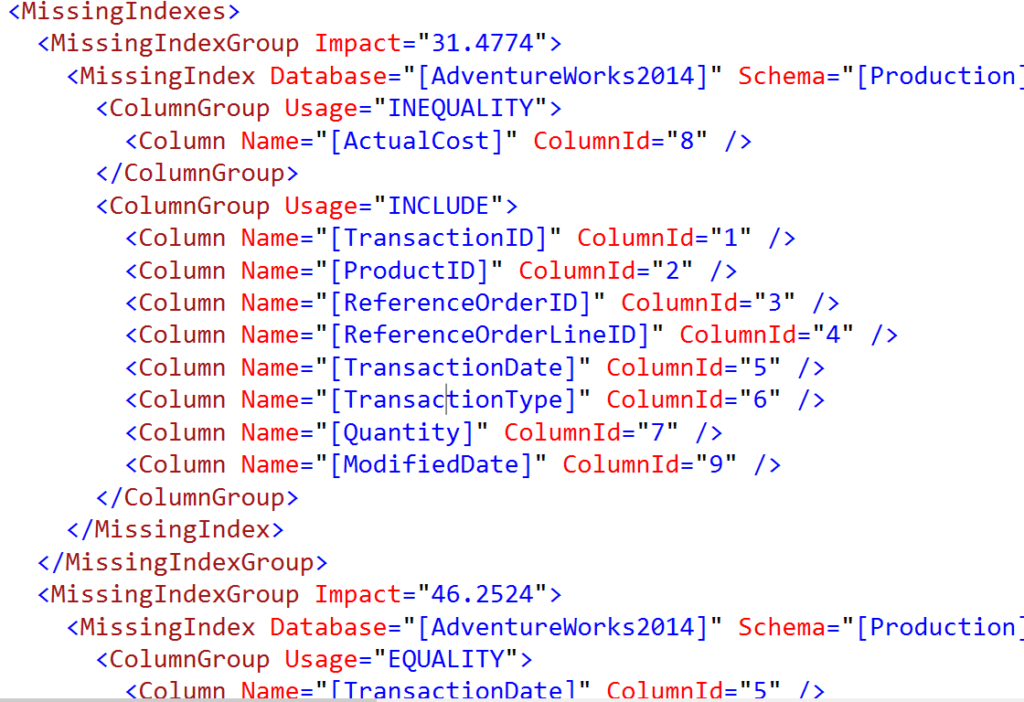
This is missing index request #1, and by default, this is the only missing index we’ll see by looking at the graphical execution plan. There’s actually a missing index request #2, which we can find in the XML (I know, it’s a little ugly to read. Bear with me).

Missing index request #2

That’s a snippet of the XML from the same execution plan. At the top, the 31 cost missing index request is for missing index #1. Right below that, there’s the entire definition of another missing index, request #2.

I find this example interesting because the query starts with a ‘where’ clause on the TransactionDate, and the server estimates the impact of that missing index to be 46, which is higher than 31. Yet when we look in the graphical view, the only request for an index that we can see is request #1, on ActualCost.

What’s the moral of this post?

This is just one of many reasons that missing index requests can be unreliable. I wrote this example specifically to demonstrate that there can be more than one missing index request in a single query.

Stay tuned! More performance posts coming out soon.


Favorite DMVs: sys.dm_exec_input_buffer

This is post 2 in my favorite DMVs series. I’m cheating a little and picking a Dynamic Management Function for this one.

DBCC INPUTBUFFER vs sys.dm_exec_input_buffer

If you’re still using DBCC INPUTBUFFER, that’s okay. I just want to show you why you should consider using dm_exec_input_buffer  instead. According to the documentation, you can start using this function as long as your server is SQL Server 2014 SP2 or higher.

Why it’s useful

So why do I like this function so much? I like it because it’s so fast and it allows you to check input SQL commands across many different sessions at once. If your server is experiencing pressure across CPU, memory or other resources, having something this fast in your toolbelt can be incredibly useful.

Useful columns

event_info: This nvarchar(max) column is the only output column that I care about it, and it’s the query that was submitted to your server

Examples

To set up an example for this post, I’ve created a parameter sniffing scenario that I use in my Plan Cache Performance Tuning session.

Essentially, there’s a plan in cache for PostType = 1, and I’m running a lot of queries looking for PostType = 3. The plan in cache isn’t optimal for the queries executing, and they take a long time to execute. That said, here’s the example:

SELECT 
	s.program_name, 
	input_buffer.event_info
FROM sys.dm_exec_sessions as s 
JOIN sys.dm_exec_requests as r on r.session_id = s.session_id
CROSS APPLY sys.dm_exec_input_buffer(s.session_id, r.request_id) as input_buffer
WHERE s.is_user_process = 1 
and s.status = 'running' 

More details

I’ll be posting a full script using some of these DMVs in my blog later this week, so please stay tuned!

Favorite DMVs: sys.dm_exec_sessions

Here’s a link to the Microsoft documentation on this DMV.

This is part 1 in a series I’m writing about my favorite Dynamic Management Views in SQL Server. I’m going to talk about how they’re useful, and then build on each post in the series by showing they’re connected.

Why it’s useful

Well, as the name implies, this DMV shows all the current sessions connected to your system. When I think of current sessions, I often think about queries that users are running on the server, but there’s also system activity. When I’m troubleshooting, sometimes I want to see both user and system activity, and this DMV allows me visibility to both.

Useful columns to query

login_name: Find the user who’s executing the session on your server

host_name: Find the computer that’s hosting the session

reads, writes, and logical reads: Useful for judging the total activity of one session

is_user_process: 0 for system processes, 1 for user processes

status: There’s a few different status but the most important ones are sleeping or running

program_name: The name of the program used to create this session. See the example below

Example query using this DMV

SELECT host_name, login_name, writes, reads, logical_reads, program_name
FROM sys.dm_exec_sessions as s 
WHERE s.is_user_process = 1
and s.status = 'running'
ORDER BY s.writes DESC


Is SQL Server using all of your server’s memory?

I’ve worked with a lot of great system administrators and developers. There’s one unusual thing about working with databases that’s often confusing for non-DBAs. This post is to help in those situations.

When an application is using 80-95% of a system’s memory, that’s concerning

Yes, even if it’s Chrome. Close some Chrome tabs please!

However, in the database world, your DBAs will tell you that it’s fine for SQL Server to consume lots of memory. They say that because databases want lots of memory by design. Databases use memory to store and retrieve data fast!

Your database administrators have control of how much memory is used by SQL Server

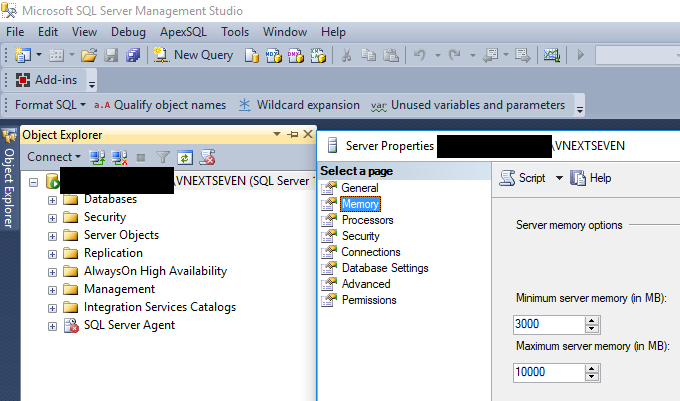
It’s right here, in SQL Server Management Studio. Right click on the server name, and go to properties.


Is 10,0000 MB the default setting?

No, I set that up for a very small server specifically for this demo. Don’t pick 10,000 just because I did.

However even in the latest version of SQL Server, the default setting is 2,147,483,647 megabytes. That does mean that SQL Server could eventually use up your entire system’s memory. Bummer.

What to do when SQL Server is using a lot of server memory

If you’re still worried about how much memory is being used by the SQL Server, check that setting. If your company has database administrators, talk to them. Check on the link for the default setting, there’s some general advice in there.

End of the post

The main moral of this story is: please don’t reboot your servers just because SQL Server is using a lot of memory. It will start to consume memory once it starts running again, and the process will repeat.

TempDB space isn’t free real estate

Using temp tables in SQL Server often seem like a great way to improve performance. But when everyone wants the same piece of land, you end up with contention or in the real world, very expensive houses.

TempDB contention example

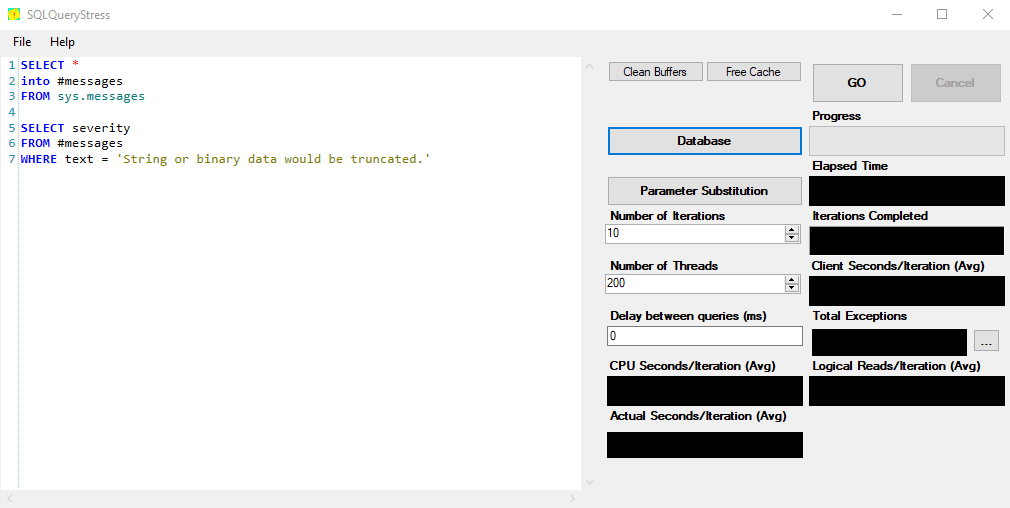
To simulate a lot of sessions running at once, trying to use TempDB, I’m going to use the free SQLQueryStress tool written by Adam Machanic (Thanks Adam!).

Now I need a query that will consume a lot of TempDB space.

SELECT *
into #messages
FROM sys.messages

SELECT severity
FROM #messages
WHERE text = 'String or binary data would be truncated.'

I’ll run this query with 200 threads because I want a lot of contention.


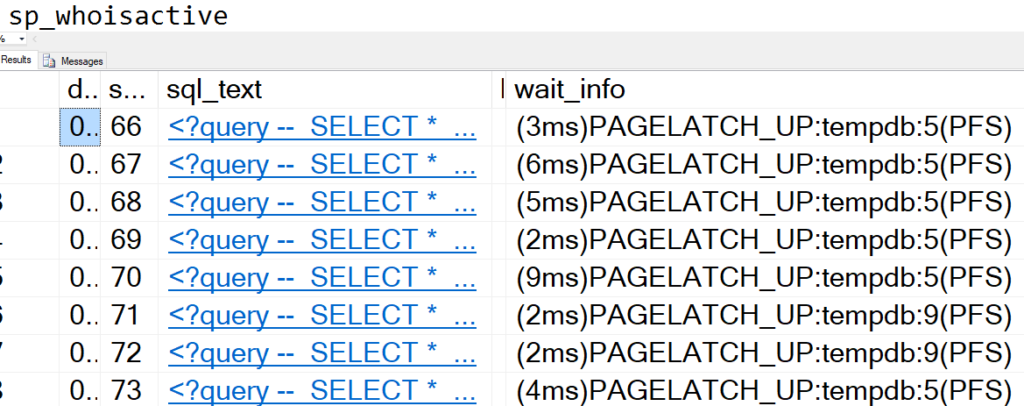
Once I kick off that process, here’s a snippet of sp_WhoIsActive.


Repeat 200 times

What’s the issue?

Well, the issue is PAGELATCH_UP on the tempDB data files, in that screenshot it’s files 5 and 9. There’s a lot of writing on the internet about the best way to solve TempDB contention. If you only have one or two files in TempDB but you have lots of CPU cores, adding more TempDB files might help.

What’s the solution?

In this example, we could filter when we load into the temp table (or not even use a temp table at all). That’s one of my proposed solutions.

Once you have decided on the right number of tempDB files, you might still see this issue. That’s why I picked an example that does searching extremely inefficiently. I want to emphasize that tuning your queries will often provide much bigger benefits than trying to use administration to fix bad T-SQL.

Let’s do two things to the query from earlier. We don’t need to load into a temp table, and we don’t need to SELECT *, we just need the severity column. Both of these improvements will reduce the total amount of resources used.

SELECT severity
FROM sys.messages
WHERE text = 'String or binary data would be truncated.'

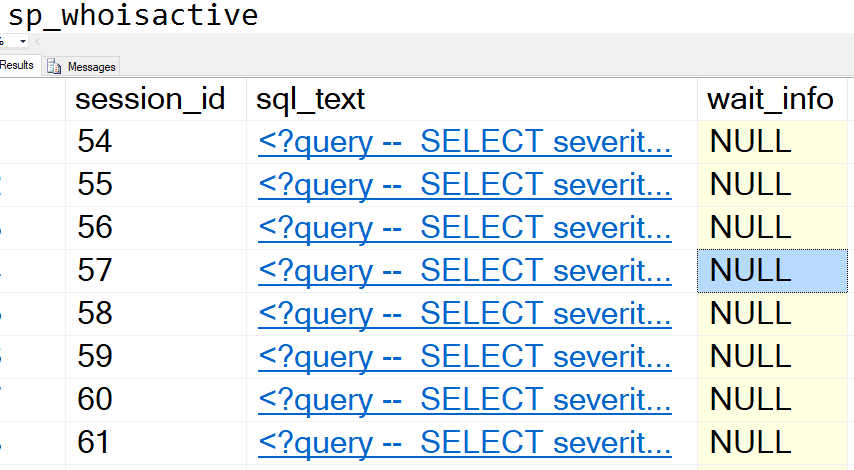
Time to take another look at sp_WhoIsActive.

What’s happening now? They’re still running?

Yes, but instead of waiting for resources, they’re all executing simultaneously.

Thanks for reading, stay tuned!


By continuing to use the site, you agree to the use of cookies. more information

The cookie settings on this website are set to "allow cookies" to give you the best browsing experience possible. If you continue to use this website without changing your cookie settings or you click "Accept" below then you are consenting to this.

Close