Favorite DMVs: sys.dm_exec_sessions

Here’s a link to the Microsoft documentation on this DMV.

This is part 1 in a series I’m writing about my favorite Dynamic Management Views in SQL Server. I’m going to talk about how they’re useful, and then build on each post in the series by showing they’re connected.

Why it’s useful

Well, as the name implies, this DMV shows all the current sessions connected to your system. When I think of current sessions, I often think about queries that users are running on the server, but there’s also system activity. When I’m troubleshooting, sometimes I want to see both user and system activity, and this DMV allows me visibility to both.

Useful columns to query

login_name: Find the user who’s executing the session on your server

host_name: Find the computer that’s hosting the session

reads, writes, and logical reads: Useful for judging the total activity of one session

is_user_process: 0 for system processes, 1 for user processes

status: There’s a few different status but the most important ones are sleeping or running

program_name: The name of the program used to create this session. See the example below

Example query using this DMV

SELECT host_name, login_name, writes, reads, logical_reads, program_name
FROM sys.dm_exec_sessions as s 
WHERE s.is_user_process = 1
and s.status = 'running'
ORDER BY s.writes DESC


One reason for using the Estimated Execution Plan

SQL Server provides performance tuners with two main methods of reviewing query performance, the estimated and actual execution plans. The estimated plan can be retrieved quickly, since the query doesn’t have to be executed. Alternatively, the actual plan will require you to execute the query entirely but it’s often worth the wait. The estimated plan is only as good as the estimates used to generate it, so as performance tuners, we want to review what actually happened.

So here’s the catch

In the real world, when you’re troubleshooting an issue, waiting for the entire query to execute is painful. If the query takes over 30 seconds, I know I’ll start to get impatient and I’ll get curious about what’s taking so long. This is where the estimated plan comes into play. While we’re waiting for our actual query to execute, let’s talk about one big reason we’d want to retrieve the estimated plan: parameters.

Parameters?

Yes, the parameters that were used to compile the plan. When SQL Server generates an execution plan, it records the parameters that were used. Here’s another tricky part: those might not be the same parameters that you’re using to test the query. Let’s take a look at an example using the Stack Overflow database.

10 second introduction to StackOverflow2010

(Download StackOverflow2010 here)

In the world of Stack Overflow, the Posts table has all the questions and answers from the site. There’s a lot of those questions and answers, but there’s just a few wiki type posts.

Here’s my stored procedure to retrieve all the posts of a certain type:

CREATE PROCEDURE [dbo].[QueryPostType] (@PostType INT) 
AS
BEGIN

SELECT PostTypeId, 
	  Tags,
	  Body 
FROM Posts where PostTypeId = @PostType

END

Now to actually test this, we need to run the stored procedure once.

EXEC QueryPostType @PostType = 1;

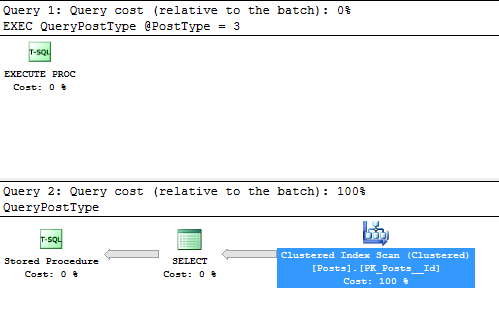
Alright. Executing the query with the parameter for the questions, post type of 1, should put that plan into the plan cache. Let’s take a look at the estimated plan for a different parameter, 3, which is the wiki post type.

EXEC QueryPostType @PostType = 3;

Just right click on that “SELECT” and look at the parameters. Here’s the useful part:

That’s all I have for this reason and this post.

I just wanted to provide the parameters in defense of estimated plans. This trick becomes really useful if you’re trying to determine if your query is a victim of parameter sniffing, since you can see what parameters were sniffed and placed into cache.

SQL 101: Two places to start troubleshooting

Getting started

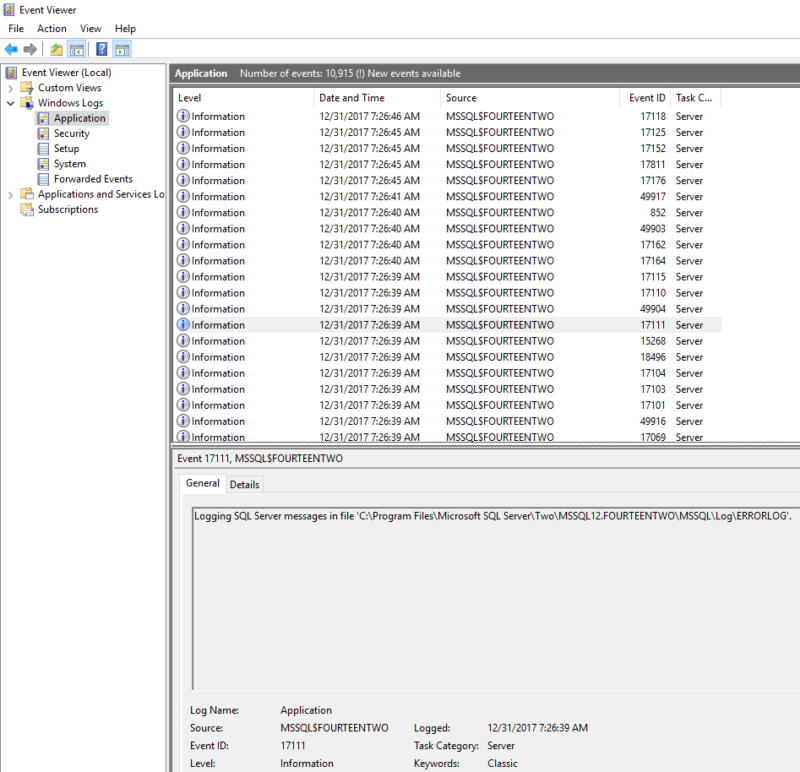
Someone calls you at 1 AM on Saturday and says, “Is there an issue with SQL?” First, breath and take a look at your logs. This post is about two places you can take a look to see if there’s an issue, quick, so you can get back to sleep. Especially when I was new to SQL Server, I thought fixing an issue would involve querying the server to see what was there. However, both of these locations are available through the GUI and are easy to get to. The two places I’d start looking are the Windows Server Application Log, and the SQL Server Log.

What to look for

In both of these locations, look for the last date time when you knew SQL was working. Then look messages about errors from SQL in between then and now.

1: Windows Server Application Log

My favorite way to read this log is with the app Event Viewer. You can search for this app in Windows or you can go to the file directory: C:\ProgramData\Microsoft\Windows\Start Menu\Programs\Administrative Tools

Start up this app. By default, it shows the logs of your local computer. To connect remotely, go to the top left of the app, click Action -> Connect to another computer

Once you’ve got the app running, go to Windows Logs and click on Application. It’s as easy as that. If you have multiple SQL Server instances running on the same server, you can look at the “Source” column to see what instance wrote to the log.

Here’s what you should see:

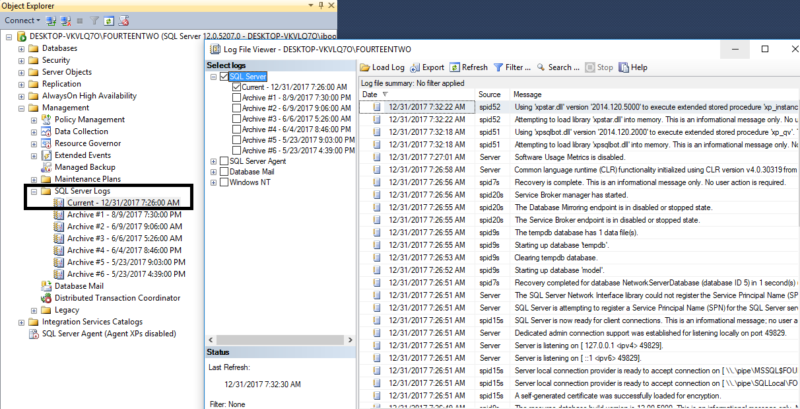
2: SQL Server Error Log

Another useful log. To find this one, you can go to the file location listed in the screenshot above. That’s for my local instance, yours will be slightly different since my instance is named “FOURTEENTWO” (SQL Server 2014, instance #2 on this server).

Or

You can open SQL Server Management Studio (SSMS). Connect to your server, in Object Explorer go to Management -> SQL Server Logs

Guaranteed?

No. I can’t guarantee that this will help you fix your issue. But I always forget it! It’s saved me a lot. Here’s a list of things that are logged in these locations, that I’ve needed to find:

  • When SQL Server started
  • When SQL Server crashed and where the log dump is stored from that crash
  • Changes in compatibility level of databases


SQL Saturday Nashville #698

Why pick my session?

Hi, I’m Arthur Daniels. I’m presenting Reading Execution Plans Successfully at SQL Saturday Nashville. If you’re considering attending my session, I’d really like to see you there! I deal with execution plans daily. They can be really gnarly, and it takes a lot of time to work through the larger execution plans. I wrote this session as a foundation for performance tuning. Some of the things I’ll be talking about are:

  • What an execution plan is, behind the picture in management studio
  • The execution plan cache and what it can be used for
  • Finding where to start reading an execution plan
  • Interpreting a lot of the information provided on an Index Seek
  • When to use Query Store, and when the execution plan cache could be better

Ask questions

I think the best place to ask a question is in person. I might not have the answer you’re looking for, but I know a lot of great places and great people that we can ask. If you’re stumped (especially on performance), I encourage you to come ask.

Who am I?

My name is Arthur Daniels. I work primarily on performance for SQL Servers at SAP Fieldglass. I spend a lot of my time finding ways to improve and rewrite queries, and occasionally adjust or add indexes. If you want to talk about something I covered or didn’t cover in my session, please feel free to catch me after my session!

Read the slides

If you want the latest version I’ve used, here is the SQL Saturday Minnesota where I last gave my presentation. I also provide my slides on my website, here‘s a copy of the slides when I first gave this presentation. I’ve been spending the time between presentations improving.


TSQL Tuesday #96: Folks Who Have Made a Difference

Well, this is my first T-SQL Tuesday! Here’s the original post: link. I’m very excited to participate. The host for this month is Ewald Cress (blog | twitter ) and the subject is talking about people who’ve made a difference. I’ve been working with SQL Server for a few years and I have many people to be grateful for! I thought I’d start by sharing the story that I use in my presentation, Reading Execution Plans Successfully.

My first SQL job was a Junior BI Developer, right out of college. I was learning from Treye Nekola , a Sr Database Administrator. At the time, I could write a SELECT statement, but I had trouble with JOINs and WHERE clauses. Sometimes my queries would run for minutes a time, even with NOLOCK hints they were taking a while. Treye had the wisdom to call me out on it, and I said something very foolish. I said, “I don’t care how long my query takes as long as it gets results.” Treye just looked at me, knowing how stupid that sounded. I let it go, because I was embarrassed. He was right, and my queries needed work. Over the next months, Treye showed me why my queries were poorly written, and with a godly amount of patience, he set me on the right path. I will forever be grateful to Treye for being an awesome mentor and friend!

The next person I’d like to appreciate is Brent Ozar. I doubt Brent knows much about me, but his material and training has seriously improved my skills. Treye showed me his blog, and I started to learn about the SQL Server online resources. Brent’s also the person who inspired me to start presenting. At PASS Summit 2016, Brent had a session titled 500-Level Guide to Career Internals. At this session, Brent encouraged the audience to start blogging and speaking. I haven’t blogged as much as I should, but I did take his advice on speaking. It has seriously improved my life to speak because I get to teach people and meet tons of really excellent people in the database world. It is so rewarding to teach people a new skill or fact.

And finally, I appreciate Andy Yun. I think I first met Andy at SQL Saturday Iowa City. We were both speakers and spent time talking in the speaker room. We parted ways for a while, but Andy mentioned he was planning on making a trip to the Iowa SQL user groups so I was sure to see him again. We met up before his presentation in Des Moines, Iowa, where I told him that I was taking a job in Illinois, and I was looking for advice. By sheer luck, it was the exact same city that Andy was living in! I had no idea he lived in the exact same suburb as I was headed to. Since that day, Andy has been a close friend and mentor to me. I’m incredibly grateful for the guidance and help he’s given me, in life and career. I say without hesitation that Andy has made a massive difference in my life.

I would like to make some honorable mentions to some people I couldn’t fit in this post, and I’m sure there’s many more that I couldn’t fit in this post.


Thank you for being great people:

Ted Schnieders

Bill Andersen

Nicole Loyd

Fred Botts (leader of the Des Moines SQL Server User Group)


Using Live Query Statistics on older SQL Servers

First, thanks to everyone who attended my session at SQL Saturday #634 Iowa City! I spoke about execution plans and how to begin reading them. Here’s a link to my session.

I had an attendee come up afterwards who mentioned that Live Query Statistics could be used with the newest version of Management Studio to watch query execution plans live on older versions of SQL Server. I was completely unaware of this, and this feature is really awesome. Live Query Statistics allows you to watch what indexes or actions SQL Server is doing while your query executes. This works really well if your query runs for one or more minutes and you want to see what is taking this much time.

Once I learned this, I was curious what versions this feature can be used on. I figured there were some limitations, so I made sure I had the latest release of Management Studio (Standalone), at the time of this post, it’s 17.1. It appears to me that the oldest version of SQL Server where this will work is SQL Server 2014, based on a test I ran locally and documentation.

Here’s the screenshot, directly from Microsoft’s documentation on Live Query Statistics:

This is super cool since it’s a lot of work to upgrade a SQL Server, and this lets me use these features without upgrading (yet).


Setting up your own (free) local SQL Server for testing

This post is designed for anyone who wants instructions on creating a SQL Server instance on any computer you’d like. At the time of writing this post, none of these steps cost any money, just some of your time and disk space on your computer.

You’ll need:

  • A free Microsoft account
  • Access to the Internet
  • Disk space
  • Administration privileges on your computer

My setup is a home desktop PC with a 1 TB data drive. I’d recommend having at least 50 GB free, but you could follow this tutorial with only 20 GB free.

Here are the downloads you’ll need (links available as of 12/12/2016):

SQL Server 2016 Developer Edition

  • To access SQL Server 2016 Dev Edition, you will need to sign up for a free Visual Studio Dev Essentials membership. This is a perpetual free membership for the email account you used to sign up.

Windows Server 2016 from Microsoft Evaluation Center

  • Pick file type of ISO

Virtual Box or virtualization technology of your choice.

SQL Server Management Studio

Please start all the above downloads while you read the instructions below. To install Windows Server 2016 on Virtual Box, you will need to enter your computer’s BIOS and turn on 64 bit virtualization. This setting might be called something else on your PC.

To begin your installations, install Virtual Box and start a new Virtual Machine (VM) by pressing the blue circle labelled “New”. You must pick a VM type of Microsoft Windows and the version must state 64 bit. I usually pick about 4096 MB of Memory because my PC has 16 GB. Pick at least 512 MB memory for your VM or it may not have enough memory.
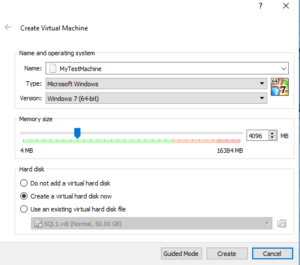
testmachine1

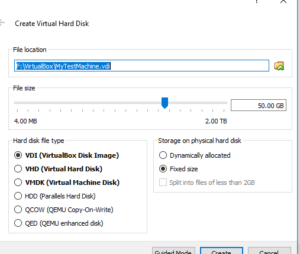
Hit the “Create” button. On the next screen, the prompt is asking to select the size of the hard drive. I picked my data drive, F, and allocated a fixed size of 50 GB. Then hit Create again.
testmachine2

Your next step is to install Windows Server 2016. Virtual box will prompt you to select your ISO file. Browse on your PC to where you downloaded Windows Server. Install Windows Server 2016 normally. The only important part is to make sure that you choose the version of Windows Server that has a GUI. In Windows 2016, the desktop experience is no longer a default option. If you don’t do this, when you boot your VM, you will not see the normal desktop.

From now, we will be using the VM with Windows Server installed. To make life easier, I recommend installing an ISO that came with your Virtual Box setup files. There’s an ISO called VBoxGuestAdditions that will allow you to map a shared network drive between your VM and your PC, once you install it. Install this and map a shared drive (Devices->Shared Folders->Shared Folder Settings), so that you can transfer files back and forth between VM and PC. You can map any ISO to your Virtual Box by selecting Devices->Optical Drives->Choose Disk Image… and then picking an ISO file on your PC.

With Windows Server installed, we still need to install SQL Server 2016 Developer Edition and SQL Server Management Studio (SSMS). The order that you install these applications doesn’t matter. To install SSMS, place the .exe that you downloaded from earlier into a shared drive that you’ve mapped. I won’t cover the process of installing SQL Server in this blog post, but the bare minimum option you need is the SQL Server Engine install. Once you have installed these two, you’ll have a functional SQL Server available in this VM.

To close your VM, you can either pick Save machine state or Power off the machine. I like to save the machine state since then I can resume where I was in my VM. Power down is just shutting down the machine.

By continuing to use the site, you agree to the use of cookies. more information

The cookie settings on this website are set to "allow cookies" to give you the best browsing experience possible. If you continue to use this website without changing your cookie settings or you click "Accept" below then you are consenting to this.

Close