Getting started
Someone calls you at 1 AM on Saturday and says, “Is there an issue with SQL?” First, breath and take a look at your logs. This post is about two places you can take a look to see if there’s an issue, quick, so you can get back to sleep. Especially when I was new to SQL Server, I thought fixing an issue would involve querying the server to see what was there. However, both of these locations are available through the GUI and are easy to get to. The two places I’d start looking are the Windows Server Application Log, and the SQL Server Log.
What to look for
In both of these locations, look for the last date time when you knew SQL was working. Then look messages about errors from SQL in between then and now.
1: Windows Server Application Log
My favorite way to read this log is with the app Event Viewer. You can search for this app in Windows or you can go to the file directory: C:\ProgramData\Microsoft\Windows\Start Menu\Programs\Administrative Tools
Start up this app. By default, it shows the logs of your local computer. To connect remotely, go to the top left of the app, click Action -> Connect to another computer
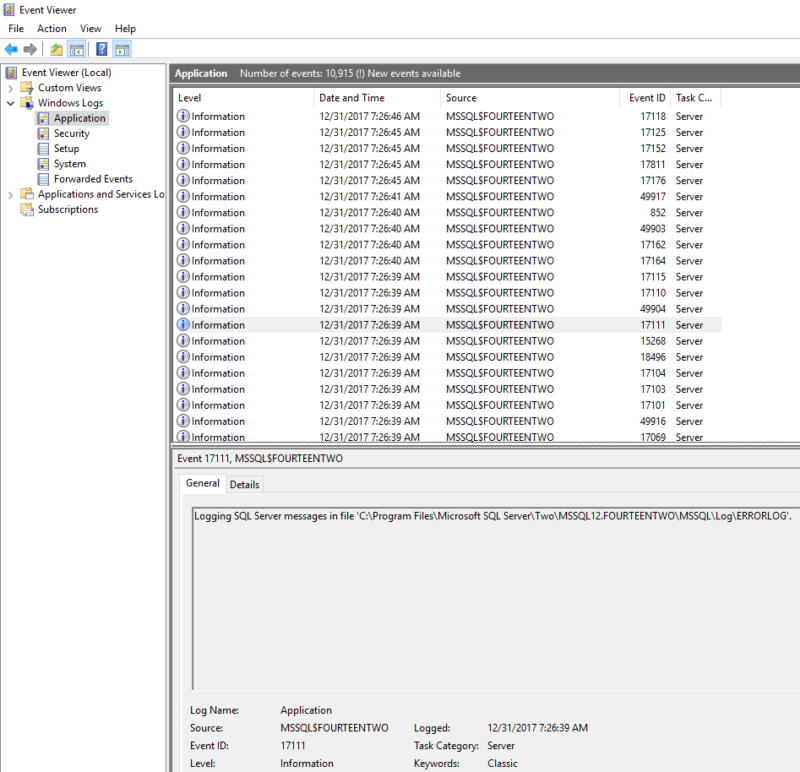
Once you’ve got the app running, go to Windows Logs and click on Application. It’s as easy as that. If you have multiple SQL Server instances running on the same server, you can look at the “Source” column to see what instance wrote to the log.
Here’s what you should see:
2: SQL Server Error Log
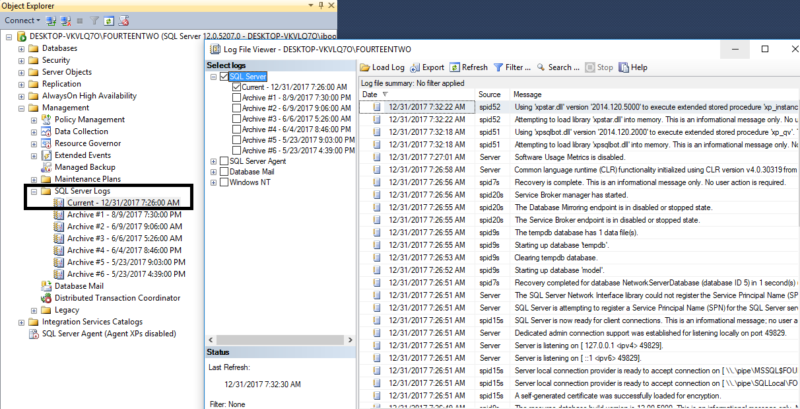
Another useful log. To find this one, you can go to the file location listed in the screenshot above. That’s for my local instance, yours will be slightly different since my instance is named “FOURTEENTWO” (SQL Server 2014, instance #2 on this server).
Or
You can open SQL Server Management Studio (SSMS). Connect to your server, in Object Explorer go to Management -> SQL Server Logs
Guaranteed?
No. I can’t guarantee that this will help you fix your issue. But I always forget it! It’s saved me a lot. Here’s a list of things that are logged in these locations, that I’ve needed to find:
- When SQL Server started
- When SQL Server crashed and where the log dump is stored from that crash
- Changes in compatibility level of databases

